

Is visual navigation over land without GPS ‘solved’?


Share article


In aviation, one of the most economical fallbacks to GPS (increasingly unavailable) is camera-based navigation. However, after proving a visual navigation system can reliably work on many test flights, many systems can still catastrophically fail in unpredictable ways. This leaves OEMs and end users scratching their heads. Why did the behavior of the system drastically change? How do we predict this behavior ahead of time?
The reason is fundamentally, visual navigation is a visual AI problem. The only way to know if it works is to test it across every scenario that changes what the camera sees. A singular metric is only as meaningful as the data it used for testing. Scoring it honestly means answering two hard questions.
What is a meaningful benchmark? A vision system is only as good as what its camera sees. Good performance over dense environments like forests says little about sparse environments like desert flats. A different lens, a faster aircraft or a map that is a season out of date all changes the camera’s input. Therefore, working at one site, on one platform, with one lens proves almost nothing. We must test across every input that changes the picture.
How to compare to GPS without contamination. You need to know where the vehicle really was, and the only practical reference is GPS, the very thing visual navigation is meant to replace. However, in UAVs, the autopilot's fused position looks like a reference but is not one, because the visual navigation system’s own output is fused into it. So every benchmark flight is scored against the autopilot's raw GPS fix, logged straight from the receiver before Dragonfly's output is fused in.
This post covers how our T&E team evaluates Dragonfly to ensure it delivers on its software-only promise, the four variables we test across, the metrics we score with and why, and where Dragonfly stands today, broken out by each variable.
The Four Horsemen – variables that degrade performance
Every flight in our benchmark is characterized across 4 dimensions: the terrain under it, the camera looking at it, the platform carrying the camera, and how much the world has changed since the map was made. Each one can break a vision system on its own (see why below), so we report results for each rather than one blended number.
Terrain
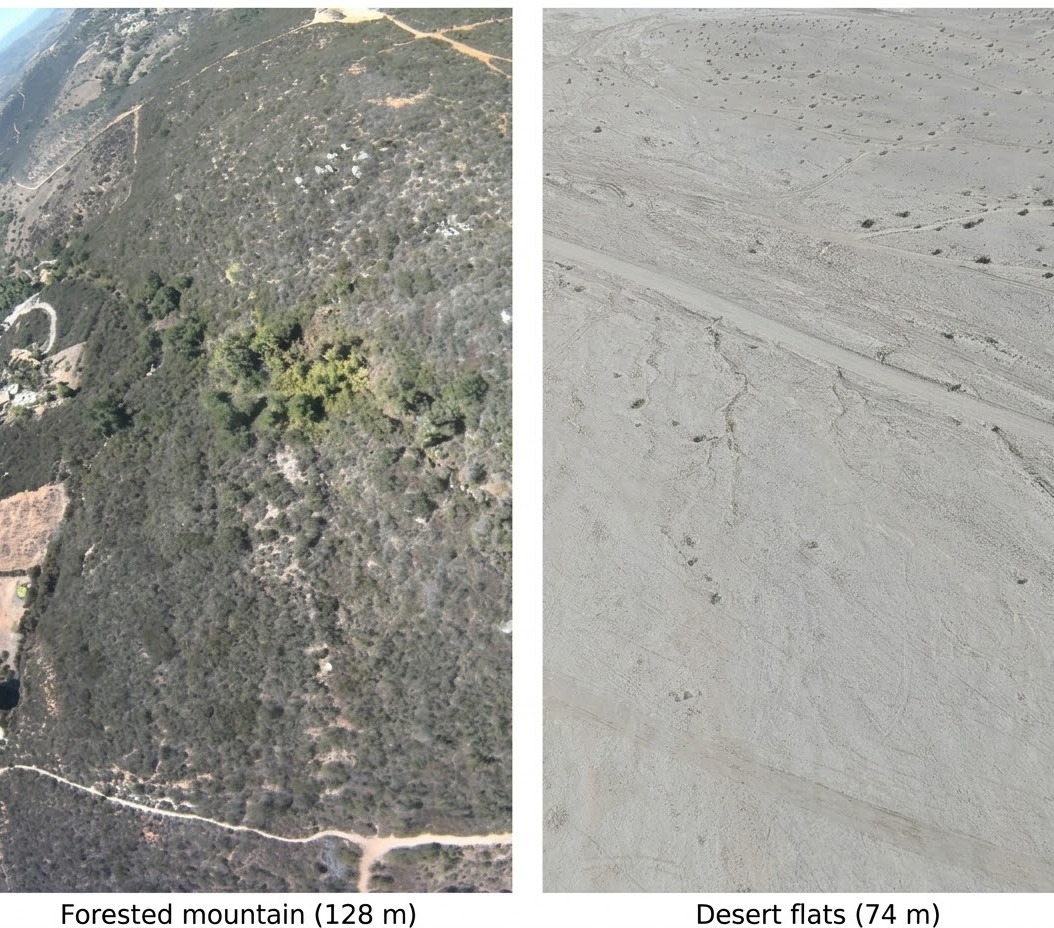
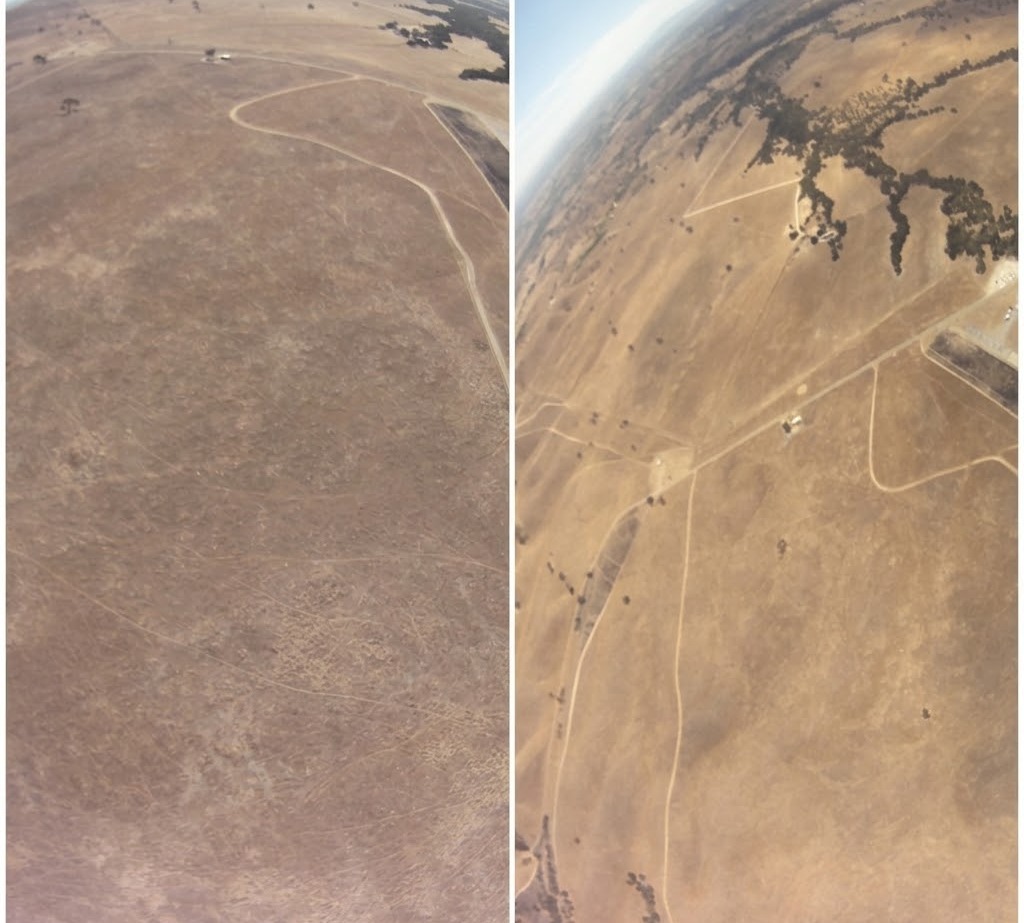
Map matching needs distinctive features. Forested mountains and boulder deserts give it plenty. Desert flats and open grassland give it very little, so Dragonfly has to rely on tracking its relative motion for longer between map fixes, and error builds up while it does.
Camera type and orientation
The camera is one of the biggest variables affecting visual navigation performance. It’s also the reason why almost 95% of solutions in the market require dedicated hardware and support only 1 camera, and can’t support real software-only integration in under 1 week.
First, different OEMs mount cameras at different angles. The same terrain can look completely different when the camera is at 0 degrees to the horizon vs 90 degrees (straight down). Most map matching algorithms behave completely differently when the camera tilt changes, even by just 10 degrees.
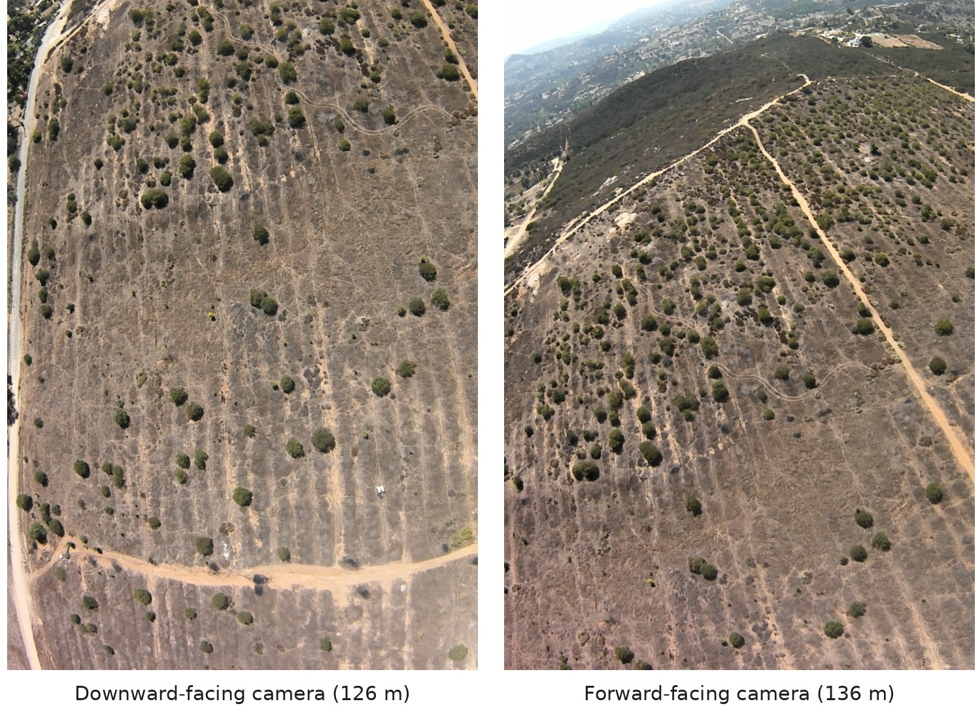
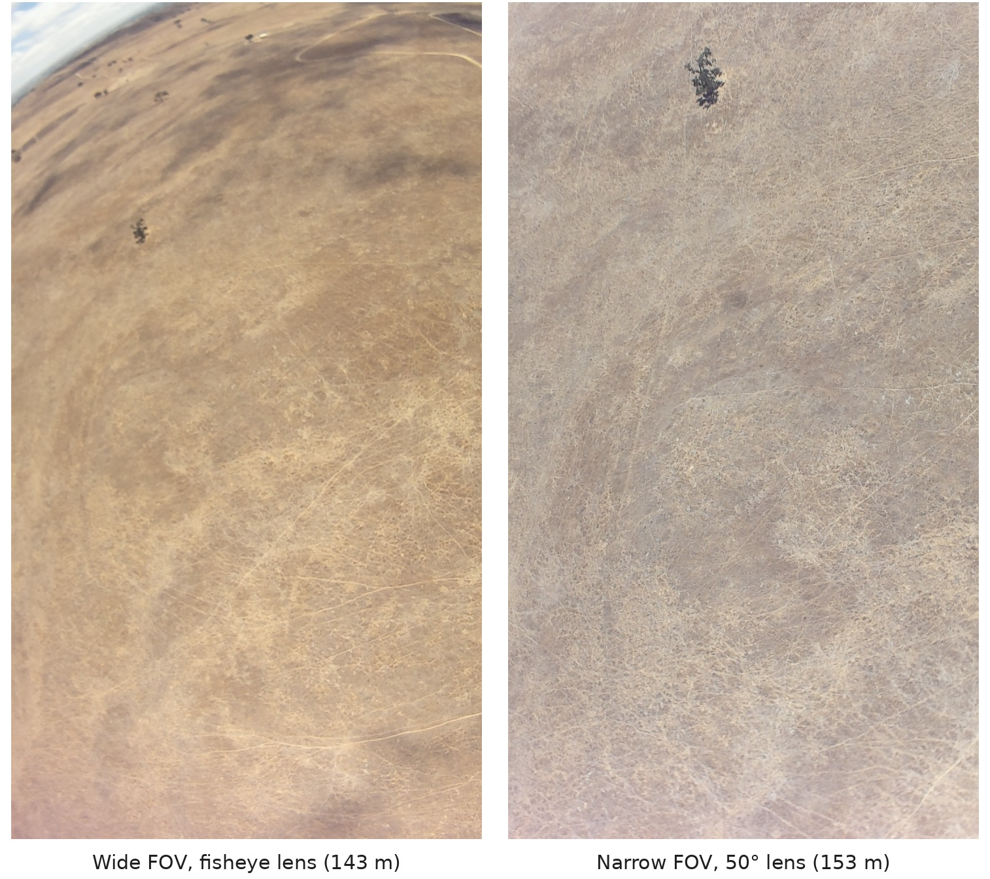
Second, the same ground looks different through different camera lenses due to optics. Field of view sets how much terrain is visible in each image; the intrinsics (focal length, distortion) set how that frame has to be warped to line up with the map; the mount angle sets how oblique the view is. We fly EO cameras with different fields of view and intrinsics, at more than one mount angle.
Platform
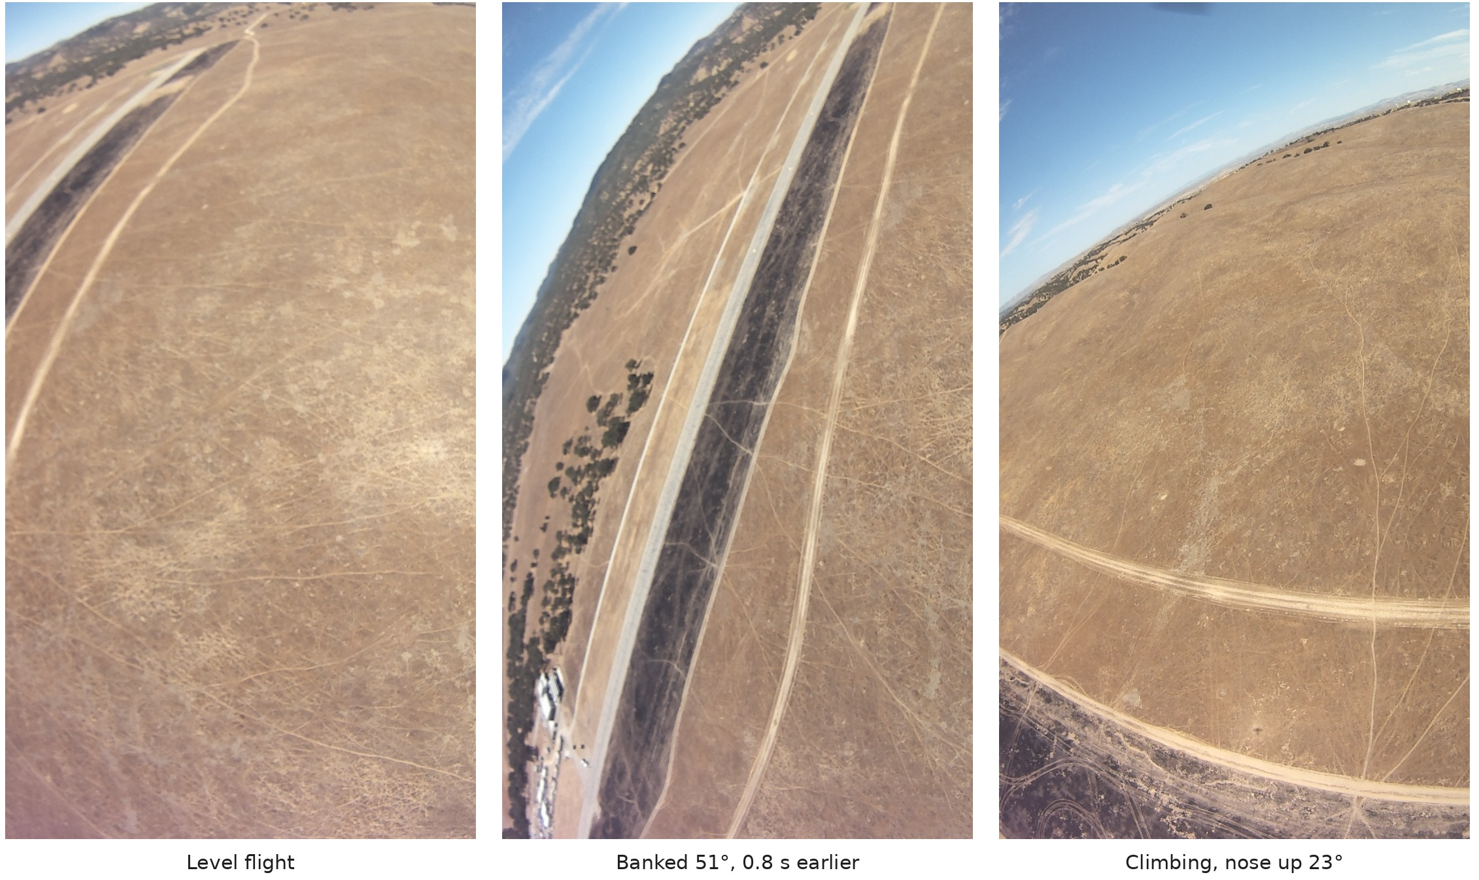
Fixed-wing aircraft, quadcopters and larger crewed aircraft fly with different dynamics. These dynamics affect what the camera sees, especially if the camera is not gimbaled and banks curves at extreme angles.
Different platforms also can fly at different altitudes. Different heights and speeds and carry the camera differently. Altitude matters most. Low down, the camera sees too small a patch of ground to match against a map. Our flights run from about 100 ft to 8,000 ft.
Climate and map changes
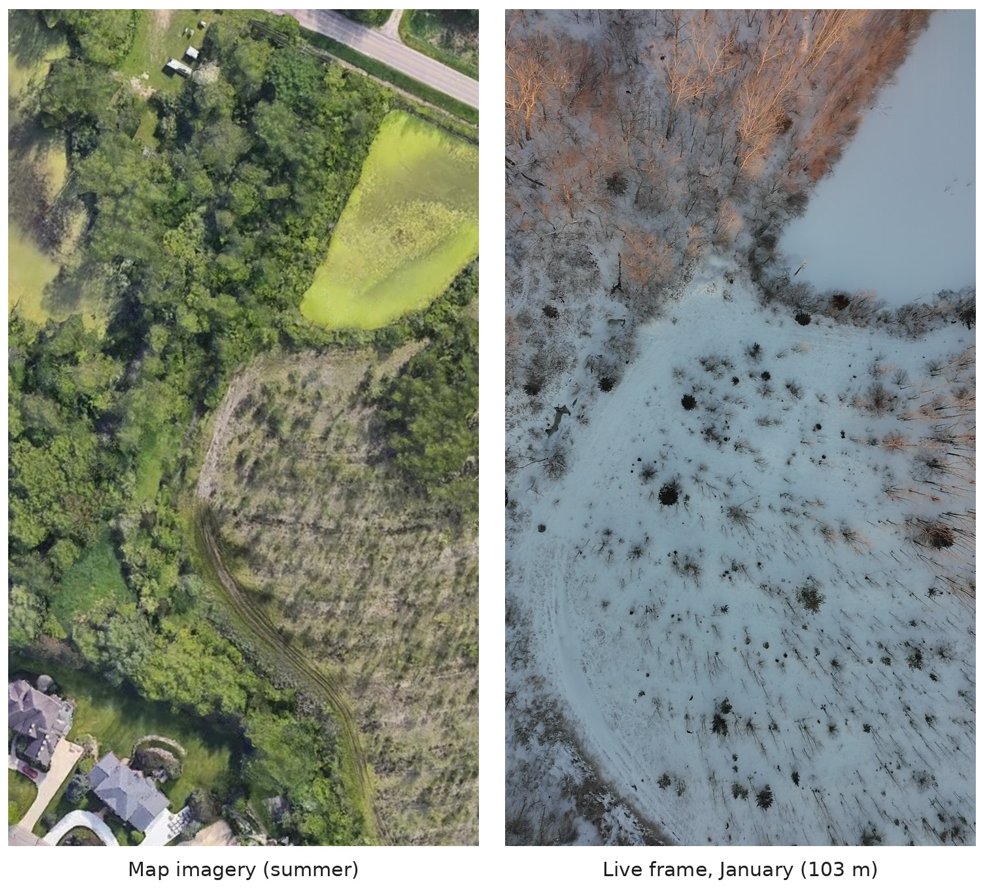
Maps may update, but the terrain can still change in just 30 minutes. Snow covers fields that were green when the imagery was captured, seasons shift colours and shadows and new buildings and roads appear. A system that only works when the ground matches the map exactly will not survive deployment – especially when the camera is zoomed into the ground.
Metrics for scoring each flight
Every replay is scored frame by frame against the autopilot's raw GPS fix. We report several numbers together, because each one hides something another shows.
Why not the autopilot's position?
The obvious reference is the position the autopilot already publishes. We tried it first, and what we found is why we now insist on a separate GPS record.
The autopilot publishes a fused position that looks like ground truth. On five test flights from a single day it drifted up to 783 m away from raw GPS. Dragonfly's live errors, measured in flight against that fused position, came out 3 to 10 times smaller than the same errors measured against raw GPS.
The likely cause is Dragonfly's own odometry feeding back into the autopilot, so the "truth" partly agreed with the thing being tested. Rescoring flights E and A against raw GPS reproduced their metrics.json RMSE (87.6 m and 325.8 m), which is how we know the replay metrics are sound.
One more caveat on honesty: our replays still lean on that fused estimate. They take their starting pose from it, use its attitude on every frame and its altitude whenever there is no map match, and check position jumps against it. The results are GPS-assisted, not GPS-denied.
Where Dragonfly stands today
Across all terrains, flying ultra-low and ultra-high, across multirotor and fixed-wing platforms, Dragonfly's mean error is 12.19 m. Over feature-rich terrain it stays under 12 m; over desert flats, open grassland and long-range desert it rises to 17–27 m, because sparse ground gives it fewer map fixes – yet drift never compounds over distance or time.
Camera variety we tested
All cameras are commercial off the shelf (standard FOV, no modifications or specialized lenses)
Performance Matrix (by terrain, platform, camera and conditions):
Keeping results comparable
Repeatability takes care. Two replays of the same flight, with identical code, config and data, matched frame for frame until frame 4,619. There a pose solver with a 0.2 s wall-clock time limit ran out of time in one run and not the other, and from that frame on the two runs diverged. So we compare settings over several repeats or start frames, never one run each, and run nothing else on the machine during a comparison.
Any change to Dragonfly can also be benchmarked on the target hardware before it merges: a sweep of one flight per platform and region, pinned to that change's exact code, with the results posted back for review.
What's next
Physical AGI means software that works across domains. Our results indicate it is possible to ship a unified spatial AI stack that works across systems – thus allowing it to scale to more platforms easily.
Visual navigation over land, like any other autonomy problem, isn't solved just because it works in one place, on one platform, on a specific camera. It has to hold up across terrain, cameras, platforms and a changing world, measured against a reference the system can't influence. That is the bar we hold Dragonfly to.
Finally, every result here is over land. Stay tuned for how we're approaching this for maritime.
